| | |
| Big Black Candle Has an unusually long black body with a wide range between high and low. Prices open near the high and close near the low. Considered a bearish pattern. | | Big White Candle Has an unusually long white body with a wide range between high and low of the day. Prices open near the low and close near the high. Considered a bullish pattern. |
| | | | |
| Black Body Formed when the opening price is higher than the closing price. Considered to be a bearish signal. | | White Body Formed when the closing price is higher than the opening price and considered a bullish signal. |
| | | |
| Doji Formed when opening and closing prices are virtually the same. The lengths of shadows can vary. If previous are bearish, after a Doji, may be ready to bullish. | | Long-Legged Doji Consists of a Doji with very long upper and lower shadows. Indicates strong forces balanced in opposition. If previous are bullish, after long legged doji, may be ready to bearish. |
| | | |
| Dragonfly Doji Formed when the opening and the closing prices are at the highest of the day. If it has a longer lower shadow it signals a more bullish trend. When appearing at market bottoms it is considered to be a reversal signal. | | Gravestone Doji Formed when the opening and closing prices are at the lowest of the day. If it has a longer upper shadow it signals a bearish trend. When it appears at market top it is considered a reversal signal. |
| | | |
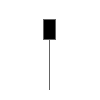
| Hammer A black or white candlestick that consists of a small body near the high with little or no upper shadow and a long lower tail. Considered a bullish pattern during a downtrend. | | Hanging Man A black or white candlestick that consists of a small body near the high with little or no upper shadow and a long lower tail. The lower tail should be two or three times the height of the body. Considered a bearish pattern during an uptrend. |
| | | |
| Inverted Hammer A black or white candlestick in an upside-down hammer position. | | Shooting Star A black or white candlestick that has a small body, a long upper shadow and little or no lower tail. Considered a bearish pattern in an uptrend. |
| | | |
| Long Upper Shadow A black or white candlestick with an upper shadow that has a length of 2/3 or more of the total range of the candlestick. Normally considered a bearish signal when it appears around price resistance levels. | | Long Lower Shadow A black or white candlestick is formed with a lower tail that has a length of 2/3 or more of the total range of the candlestick. Normally considered a bullish signal when it appears around price support levels. |
| | | |
| Marubozu A long or normal candlestick (black or white) with no shadow or tail. The high and the low represent the opening and the closing prices. Considered a continuation pattern. | | Spinning Top A black or white candlestick with a small body. The size of shadows can vary. Interpreted as a neutral pattern but gains importance when it is part of other formations. |
| | | |
| Shaven Head A black or white candlestick with no upper shadow. [Compared with hammer.] | | Shaven Bottom A black or white candlestick with no lower tail. [Compare with Inverted Hammer.]
|


Comments
Post a Comment